

Colour is the strongest signal on a map, and the easiest to misuse. A reader who sees a colour assumes it means something, so the colours have to carry meaning that matches the data.
What is a colour scheme for data?
A colour scheme assigns colours to values. Three kinds cover most maps:
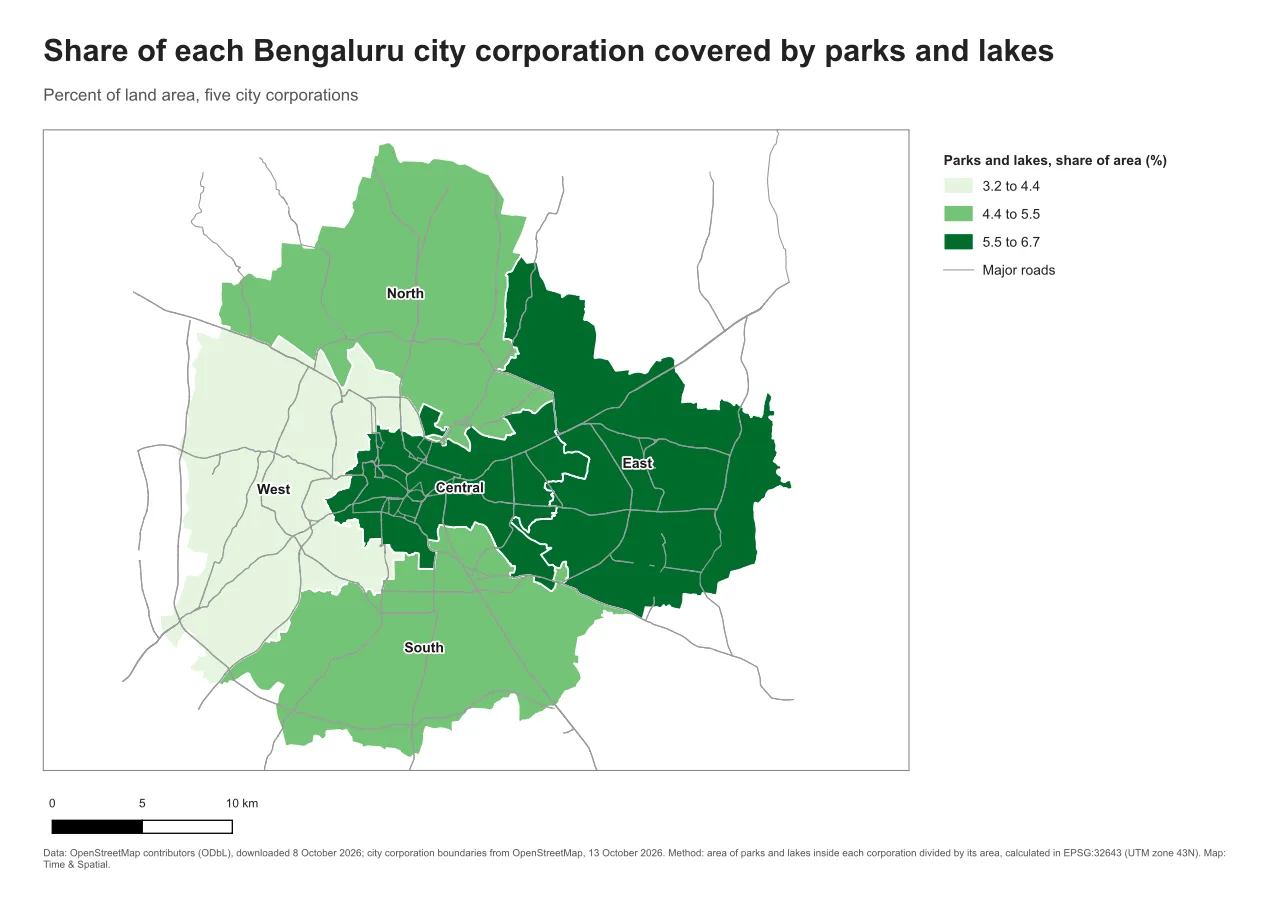
- A sequential scheme goes from light to dark in one hue, or in a gentle blend of hues, and suits ordered values from low to high, such as a share or a count.
- A diverging scheme uses two hues that meet at a light middle, and suits values that move away from a meaningful midpoint, such as change from a baseline, above or below zero.
- A qualitative scheme uses clearly different hues, and suits categories that have no order, such as land use types.
Why it matters
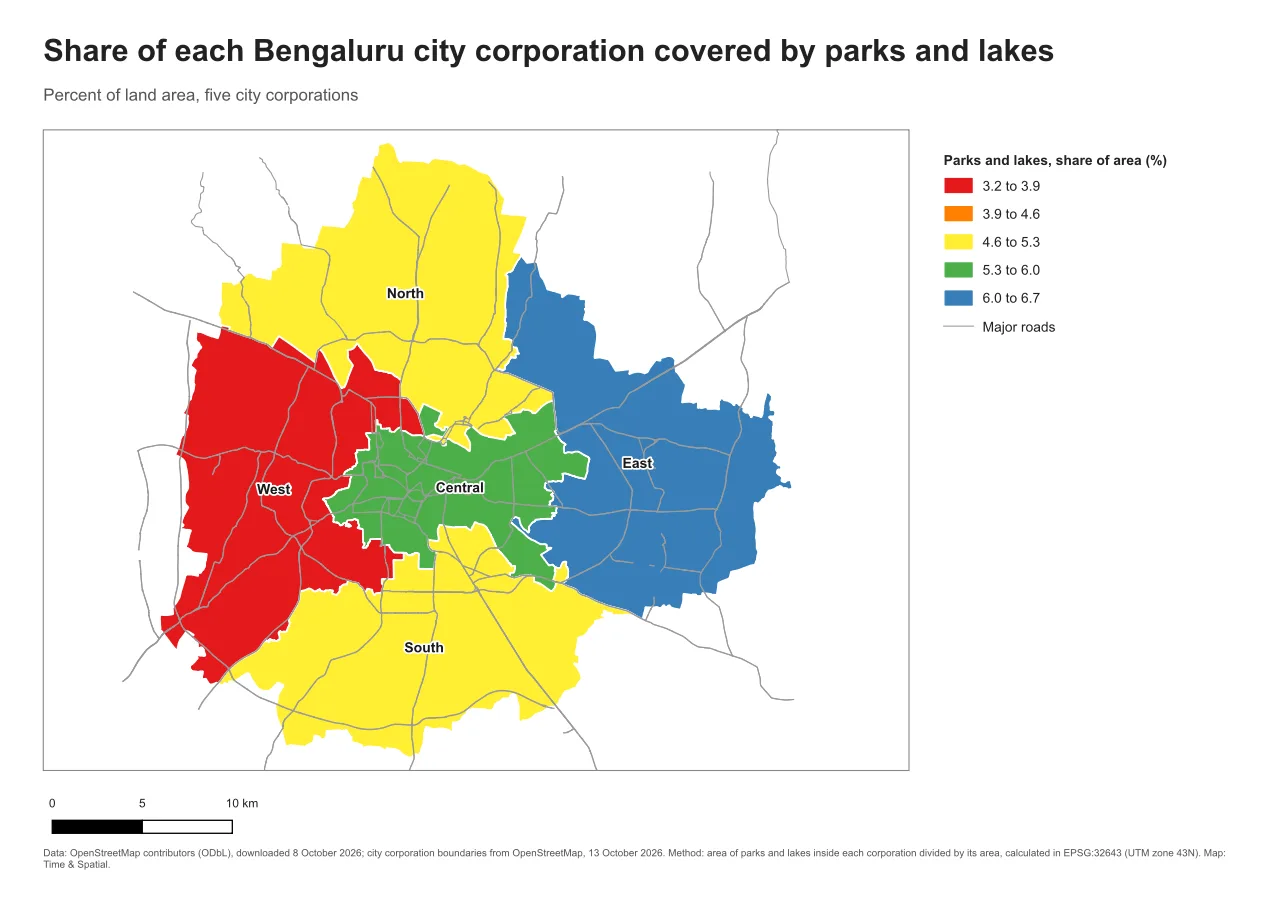
The wrong scheme makes a reader read order where there is none, or miss order where there is some. A rainbow on ordered data is the classic example. Nothing in the colours tells you whether green is more than yellow, so readers have to keep checking the legend. Many readers also see some colours differently from others. In many populations roughly one man in twelve has some form of colour-vision difference, and red and green are the usual trouble pair.
The rules
- Match the scheme to the data. Ordered values get a sequential scheme, a midpoint gets a diverging one, and categories get qualitative colours.
- Keep light for low and dark for high on sequential maps. Readers expect darker to mean more.
- Check that neighbouring classes can be told apart, and that the data stands out from the background.
- Do not rely on colour alone. Labels, patterns, line styles or symbols give a second way to read the map.
- Test in grayscale. If the classes still run in order from light to dark, the scheme will survive a black and white printout.
- Keep the background quiet. Roads, rivers and other context should be grey and thin so that they do not compete with the data.
- Use a tested palette. ColorBrewer (colorbrewer2.org) is a free tool that offers sequential, diverging and qualitative palettes, and it flags those that are safe for colour-blind readers.
See the difference
Both maps show the same five numbers, from 3.2 percent to 6.7 percent. Only the colours change.
Do it in QGIS
- Open the layer's properties and go to Symbology. Choose Graduated for ordered values.
- Choose a colour ramp. A single-hue ramp such as Greens is a safe sequential choice. QGIS includes the ColorBrewer ramps, such as Greens, Blues and RdBu, in its colour ramp list.
- Set the number of classes. Three to five is usually enough. Look at the numbers in the legend and check they make sense.
- In the Print Layout, open View > Preview Mode and choose grayscale or one of the colour-blindness simulations. Look at the page and ask whether the classes can still be told apart.
Common mistake: a rainbow for ordered data
A rainbow looks lively, which is why it is tempting. It has no natural order, it contains hues that colour-blind readers confuse, and it makes small differences look like big jumps. The fix is a single-hue sequential ramp, with a diverging ramp when the data has a midpoint.
Glossary
| Term | Meaning |
|---|---|
| Sequential scheme | A light to dark scheme for ordered values |
| Diverging scheme | Two hues around a meaningful midpoint |
| Qualitative scheme | Distinct hues for categories without order |
| Contrast | The difference in lightness between two colours |
| Colour-vision deficiency | A difference in how a person sees certain colours, often red and green |
Practise it
Make a choropleth with a rainbow, then the same map with a sequential ramp. Switch the Print Layout preview to grayscale and compare. The Print layouts in QGIS tutorial and the map design note cover classes and ramps in more depth.
Test yourself
1. Which scheme suits the share of land covered by parks?
A sequential scheme, because the values are ordered from low to high with no midpoint.
2. When is a diverging scheme the right one?
When values move above or below a meaningful midpoint, such as change from a baseline.
3. Why test a map in grayscale?
If the classes still run in order from light to dark, the map survives black and white printing and is also easier for readers who see colour differently.