

What is a spectral signature?
Sunlight contains many wavelengths. When it reaches the ground, a surface reflects some of it, absorbs some of it and, for thin materials such as water, lets some pass through. The share it reflects differs by wavelength. If you plot reflectance against wavelength, you get a curve that is typical of the material. This curve is called a spectral signature.
The word signature suggests a fixed fingerprint, and that is a little too strong. Real surfaces vary, and two samples of grass can give different curves. It is better to think of a signature as the typical pattern of a material, with some spread around it.
Reflectance is a fraction from 0 to 1. A value of 0.30 means 30 percent of the light at that wavelength was reflected.
Why materials differ
The differences come from what the material is made of.
- Healthy leaves contain chlorophyll, which absorbs blue and red light for photosynthesis and reflects a little more green. The cell structure inside the leaf scatters near-infrared light strongly, which plants do not use. Water in the leaf absorbs light in the shortwave infrared.
- Water absorbs more and more light as the wavelength gets longer. It reflects a little visible light, especially blue and green, and almost none in the near and shortwave infrared.
- Soil reflectance generally rises with wavelength. Wet soil is darker than dry soil, and the amount of organic matter and iron changes the curve.
- Built surfaces are a mixture of materials, such as concrete, asphalt, metal and tiles. Their curves vary a lot but are often fairly flat and bright across the spectrum.
Reading a vegetation curve
The curve for healthy vegetation has features you can name.
| Region | Wavelength | What happens |
|---|---|---|
| Blue and red | About 0.45 and 0.65 micrometres | Chlorophyll absorbs, so reflectance is low |
| Green | About 0.55 micrometres | A small peak, which is why leaves look green |
| Red edge | About 0.70 to 0.75 micrometres | A steep rise in reflectance |
| Near-infrared plateau | About 0.75 to 1.3 micrometres | High reflectance from leaf structure |
| Shortwave infrared | About 1.6 and 2.2 micrometres | Lower reflectance as leaf water absorbs |
The jump from the red to the near-infrared is the strongest feature, and it is the basis of the vegetation indices.
Bands sample the curve
A satellite sensor does not record the whole curve. It records a few bands, each averaging the reflectance over a range of wavelengths. Sentinel-2 samples the curve at 13 places, and Landsat 8 at seven in the visible to shortwave range. The bands are placed where the curves of common surfaces differ most.
| Region | Sentinel-2 band | Landsat 8 band | About |
|---|---|---|---|
| Blue | B2 | B2 | 0.49 micrometres |
| Green | B3 | B3 | 0.56 micrometres |
| Red | B4 | B4 | 0.66 micrometres |
| Near-infrared | B8 | B5 | 0.83 to 0.87 micrometres |
| Shortwave infrared 1 | B11 | B6 | 1.61 micrometres |
| Shortwave infrared 2 | B12 | B7 | 2.20 micrometres |
Sentinel-2 also has three red edge bands, B5, B6 and B7, between the red and the near-infrared.
Example: four places in Bengaluru
The table gives Sentinel-2 surface reflectance from the 15 March 2025 scene. Each value is the mean of a 3 by 3 pixel window, which is 30 metres on a side, at one site.
| Site | Blue | Green | Red | NIR | SWIR1 | SWIR2 |
|---|---|---|---|---|---|---|
| Cubbon Park, tree cover | 0.026 | 0.049 | 0.033 | 0.295 | 0.166 | 0.082 |
| Ulsoor Lake, open water | 0.055 | 0.119 | 0.069 | 0.056 | 0.018 | 0.016 |
| Railway station area, built-up | 0.111 | 0.138 | 0.149 | 0.210 | 0.234 | 0.207 |
| Airport, runway and apron | 0.108 | 0.137 | 0.157 | 0.242 | 0.221 | 0.193 |
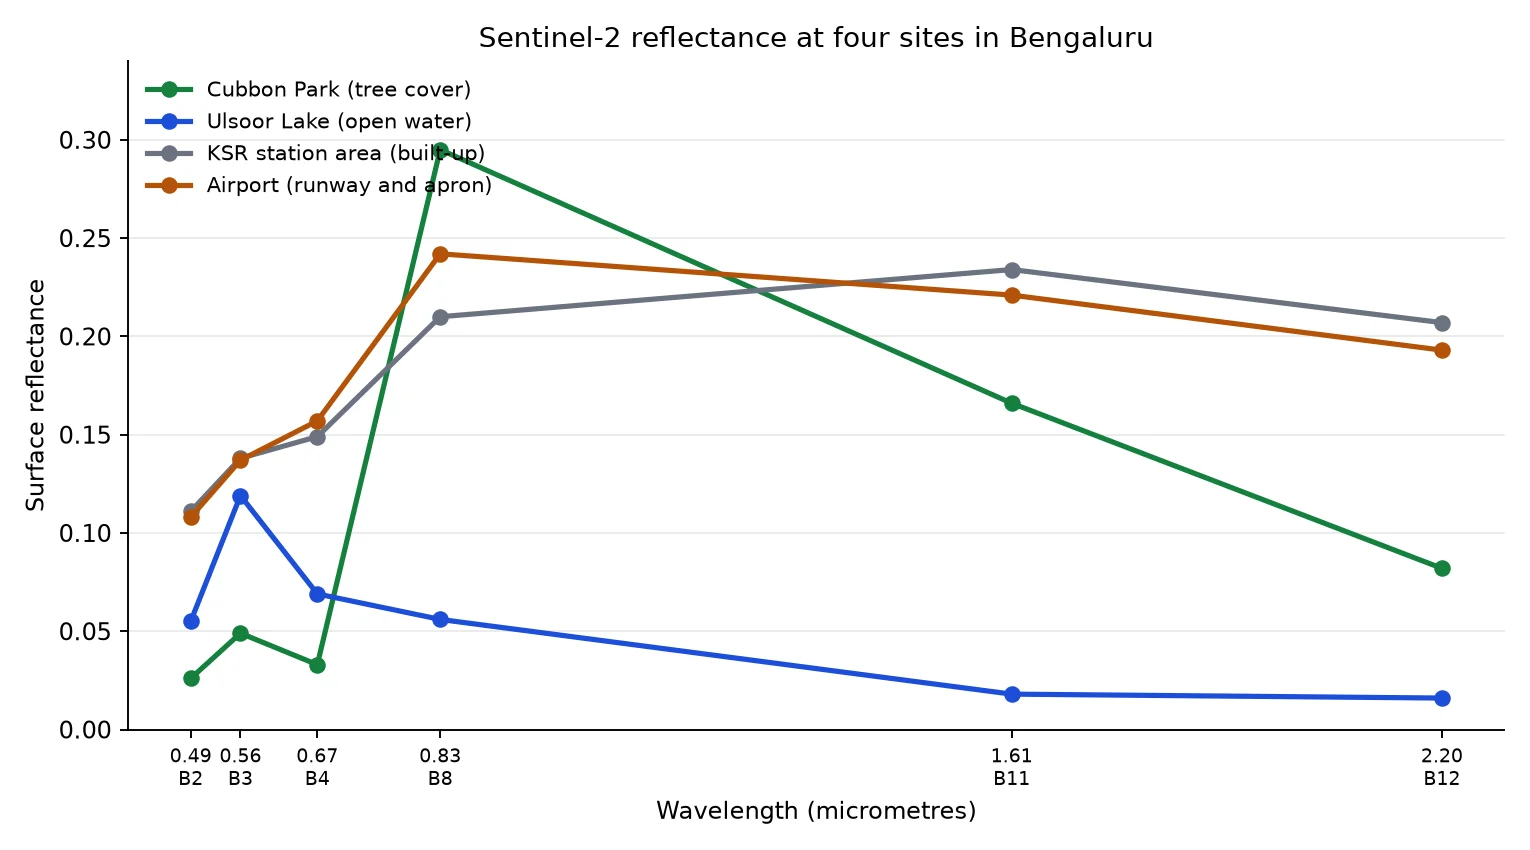
The values show the pattern described above.
- The tree cover has low reflectance in blue and red, and a near-infrared value about nine times its red value. Its shortwave infrared values are lower than the near-infrared.
- The lake has the lowest values in the infrared, close to 0.02 in the shortwave bands. Its green value is higher than its blue, which fits turbid or algae-rich urban lake water. I have no field data to confirm the cause.
- The built-up area and the airport rise gently from the visible to the near-infrared and stay high in the shortwave bands. Their curves are close to each other and are not the distinct shapes of the other two surfaces.
These are single small windows, and a window can contain a mixture. A pixel at the airport includes grass, pavement and shadow. Use them to see the pattern, and not as reference values for those materials.
What changes a signature
| Factor | Effect |
|---|---|
| Atmosphere | Haze raises the visible bands. Use surface reflectance to reduce this |
| Sun angle and shadow | Change brightness, and a shadow darkens every band |
| Season and plant stage | The curve of a crop changes as it grows, ripens and dies |
| Moisture | Wet soil and wet vegetation are darker, especially in the shortwave infrared |
| Mixed pixels | A 10 or 30 metre pixel often holds several materials, so its signature is a blend |
| Sensor | Bands have different positions and widths, so values differ a little between sensors |
Using signatures
Signatures guide many choices in remote sensing.
- Band combinations. A false colour image places the near-infrared in the red channel so vegetation shows as red.
- Indices. A ratio of two bands where curves differ, such as the red and near-infrared, highlights one surface. The chapter on spectral indices covers them.
- Classification. A supervised classifier learns the signature of each class from training samples. Classes with similar signatures, such as dry soil and roofs, are the ones it confuses.
- Choosing bands. A sensor without a shortwave infrared band cannot separate some surfaces that overlap in the visible.
To collect a signature yourself, pick sample pixels over a known surface, read their values in each band, average them, and plot the result against the band wavelengths. Take several samples, since one pixel is noisy.
Common mistakes
- Treating a signature as a fixed fingerprint.
- Comparing curves from different dates or sensors without correcting them to surface reflectance.
- Reading a mixed pixel as the signature of one material.
- Forgetting that shadows and wet surfaces darken every band.
- Sampling a single pixel instead of a group.
- Assuming that two classes with different names have different signatures.
Glossary
| Term | Meaning |
|---|---|
| Reflectance | The fraction of incoming light that a surface reflects |
| Spectral signature | The pattern of reflectance across wavelengths for a material |
| Red edge | The steep rise in vegetation reflectance between red and near-infrared |
| Absorption | The loss of light energy into a material at certain wavelengths |
| Mixed pixel | A pixel that covers more than one kind of surface |
| Band | A range of wavelengths that a sensor records together |
Practise it
The tutorial Band combinations and spectral indices builds composites and indices from these bands, and the capstone names classes by their values.
Test yourself
1. Why is healthy vegetation bright in the near-infrared?
The structure of the leaf scatters near-infrared light strongly, and plants do not absorb it, so a lot is reflected.
2. Why does water look dark in the shortwave infrared?
Water absorbs strongly at longer wavelengths, so almost no light is reflected in those bands.
3. Why should you not treat one pixel as the signature of a material?
A pixel can contain a mix of surfaces, and one pixel is noisy. Take several samples over a known surface and average them.